The Denver residential real estate market shows signs of stabilization as 2024 comes to a close. The fourth quarter has brought shifts in market dynamics, with positive signals emerging for both buyers and sellers in different segments of the market.
Data from this quarter reveals encouraging trends, with inventory levels building and buyer sentiment improving. Despite elevated interest rates, their slight moderation from peak levels has helped reignite buyer interest, particularly in neighborhoods where the market now favors purchasers.
Looking ahead to 2025, we expect single-family homes and condominiums to follow divergent paths, with modest price growth in houses but some headwinds for condos. These trends, combined with evolving inventory levels, set the stage for an intriguing start to the new year.
Key Messages for Homes and Condos
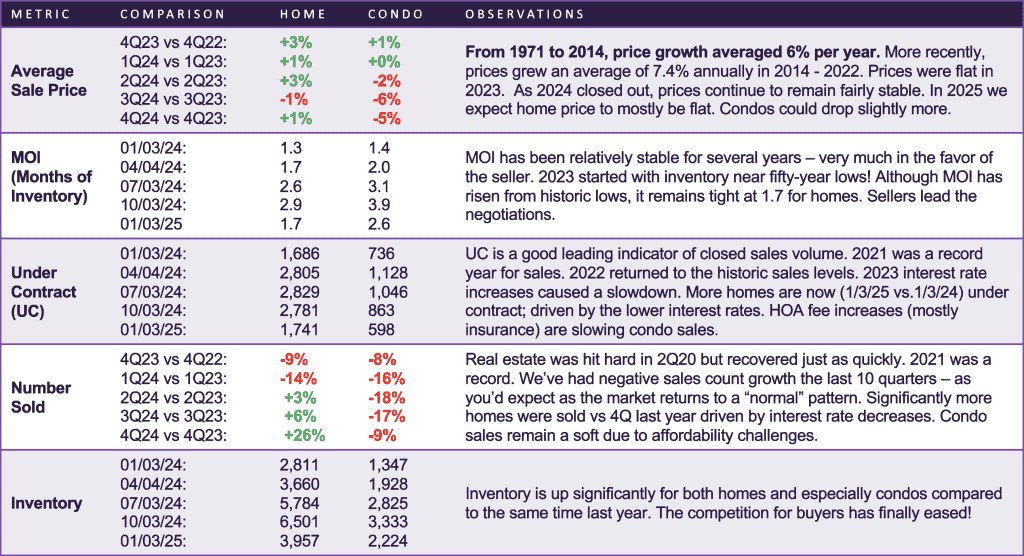
The post-COVID lockdown year (2021) was a record. The market slowed down in an orderly fashion in 2022/23. The spike in mortgage rates has limited the number of sales. Inventory is increasing. Sales prices were stable in 4Q. Condo sales continue to be weaker vs last year; home sales have continued to improve.
Historical context: Denver Home Prices
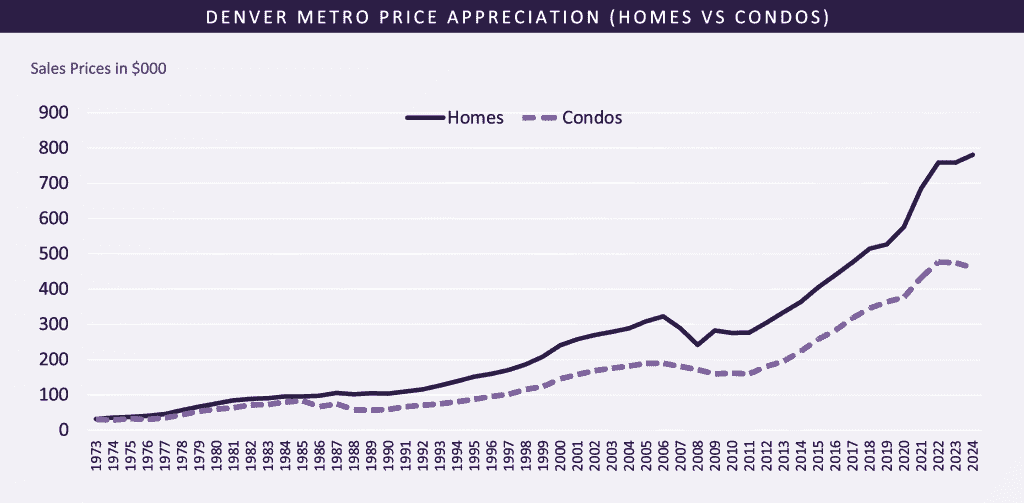
Clients always want to know how the market’s doing. Start by giving them a historical context of the Denver market.
Important points:
- The average priced home in metro Denver in 1971 was $27,000!
- On average, home prices rise 6% per year, just a bit above inflation.
- Homes have gone up in price all but 4 years in the past 44 years! So, just because we’re at record high prices DOESN’T mean prices have to fall next year. People who say that are wrong 90% of the time!
- “Experts” love to talk about a 7-year cycle. However, do you see one on the chart? Prices rose from ‘71 to ‘87 (16 years). They held about steady for 4 years. Then rose for another 16 years. Then dropped for 3 years. Note how large the 2006 – 2009 drop was.
What does it mean for the client?
- It’s important for clients to understand the market and prices move in long waves. It’s hard for them to appreciate this in a 24/7 news cycle era.
- Stay informed on articles on Zillow and the New York Times but don’t get too caught up and make a flash decision based on them.
- Look at the long-term trends to best understand the market and how it can help them make their decisions.
Historical context
Homes and condos appreciated at 6.5% and 5.6% respectively, annually, over 51 years (1973-2024). Around 1986 the desire for single-family homes began to outpace condos. In the past few years, annual appreciation has been over 10%. That’s not sustainable. We expect lower rates of appreciation in the next few years. Condos have experienced a price correction.
Inventory levels of homes.
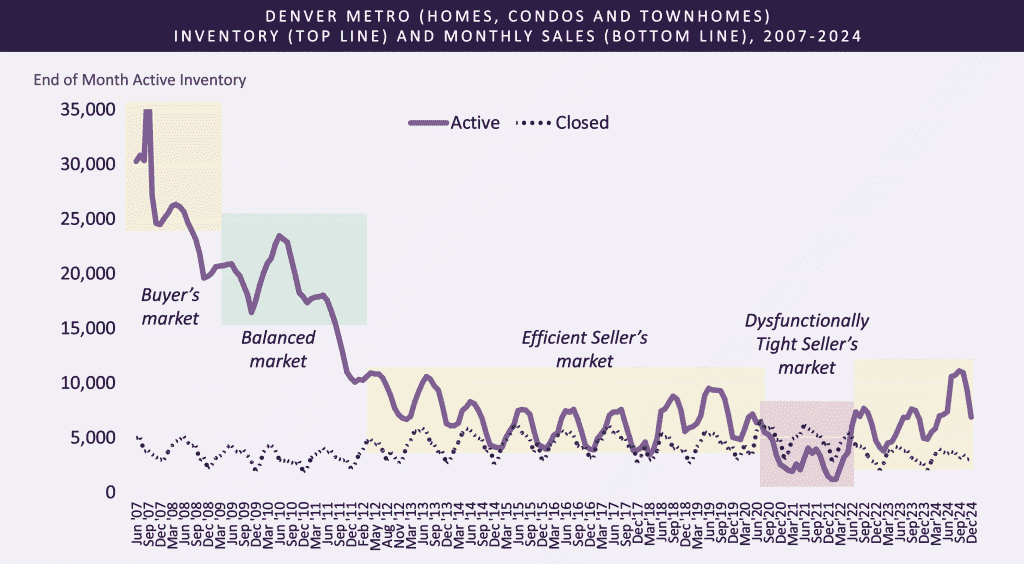
On the left side of the chart:
- The solid line on the top of the chart is the number of homes and condos for sale, from 2008 to today.
- Notice the line is very high in 2008, due to LOTS of bank foreclosures.
- Buyers didn’t buy as much during the downturn due to the scary media headlines and job loss.
- As a result, inventories were high.
- The dotted line on the bottom shows the number of homes sold each month
- Notice its been trending upwards.
- This was caused by an improving economy and growth in the population.
- Note more homes are sold in the summer than the winter
- Investors buy consistently all year.
- Families with kids in school prefer to move in the summer.
On the right side of the chart
- Notice that the number of sales is about the same as the number of homes for sale.
- There’s very little inventory and it’s competitive for buyers.
Other observations
- We didn’t arrive in this low inventory situation overnight. It took almost a decade to burn off all of the excess bank inventory.
What does it mean for the client?
- As long as the inventory is tight:
- Buyers will have to compete hard (write great offers) to win a home.
- Sellers will generally have the edge in negotiations
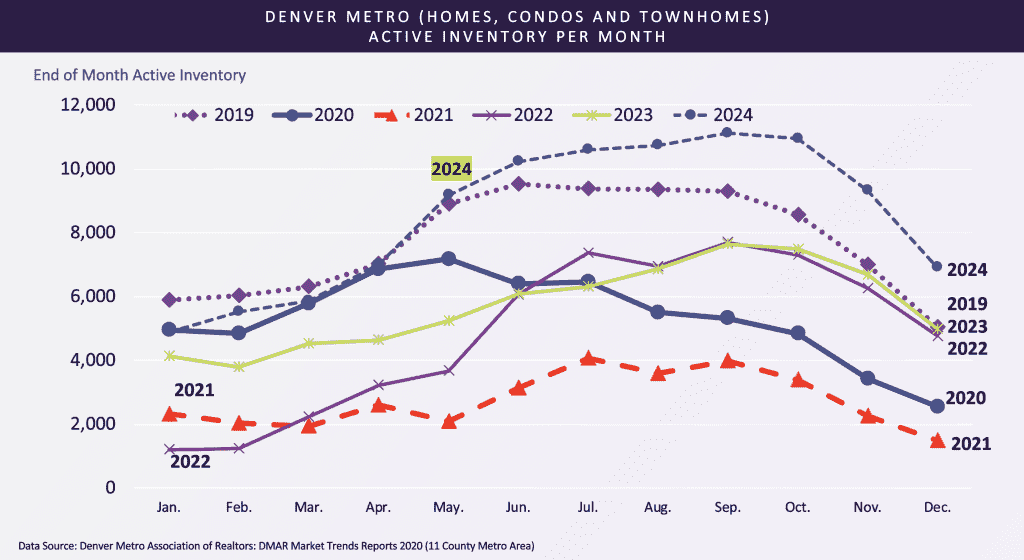
Inventory levels of homes and condos available for purchase finally started to increase in 2Q22. Inventory is no longer at record lows! Inventory is again experiencing the usual seasonal pullback we see annually.
Active Listings by Year
Inventory levels were steadily declining at the end of 2020. 2021 saw the lowest inventory levels in history. Inventory grew in 2022 & 2023. 1Q 2024 inventory mirrored the same levels we saw in 1Q 2020 Pre-COVID. Inventory has sharply increased into 2Q/3Q/4Q 2024, a welcome relief for buyers! Inventory always pulls back during the 4Q holidays, as seen yearly.
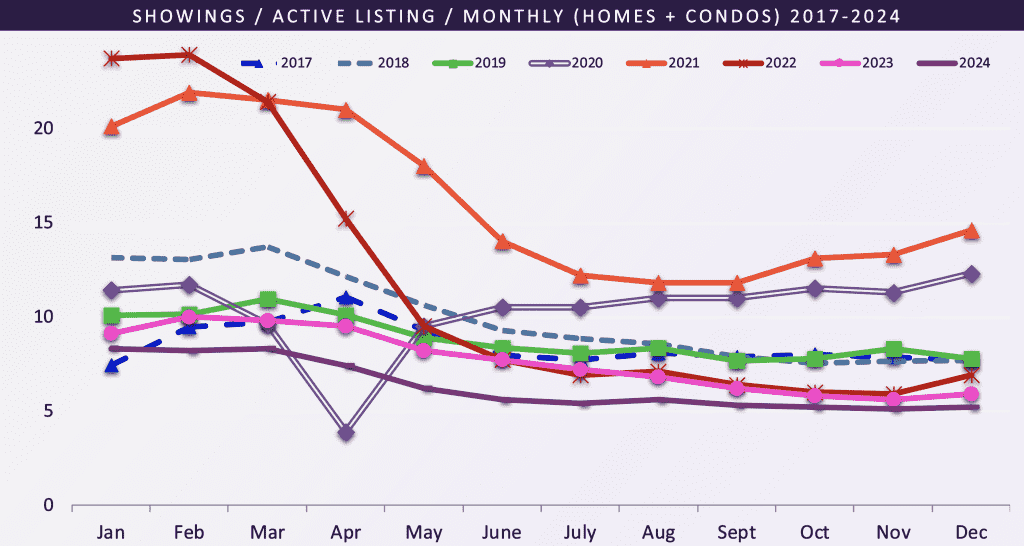
Current Market: Showing Trends
December brought 2024 to a close with some of the lowest showing traffic seen in years. Listing agents are hopeful that 2025 will see many buyers bring that number back up!
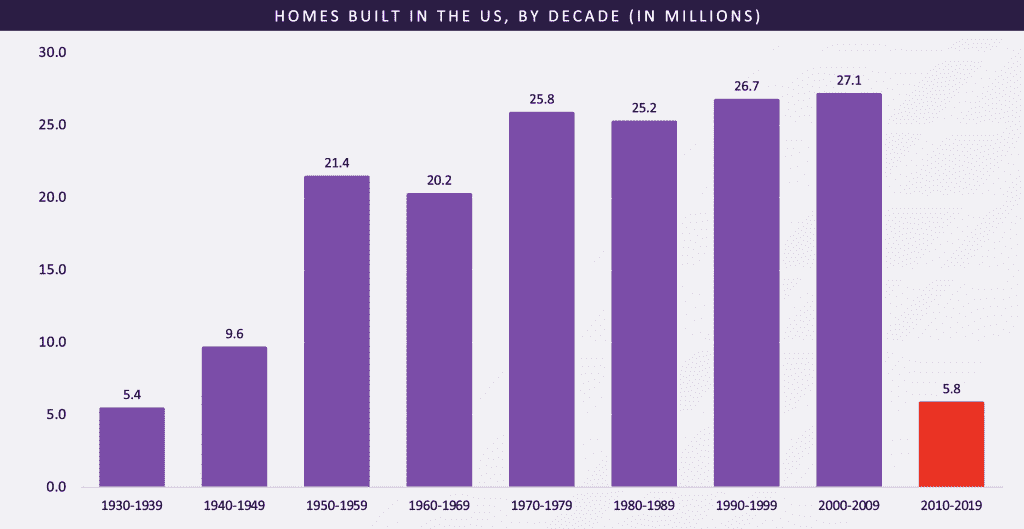
Home Builds in the United States
Why is the inventory so low? Denver has experienced strong population growth in the past decade, but almost no additional inventory from new home builders. Builders are limited by high costs for land, water taps, labor, and materials. We don’t anticipate much growth in construction. As a result, inventories could remain low for several years.
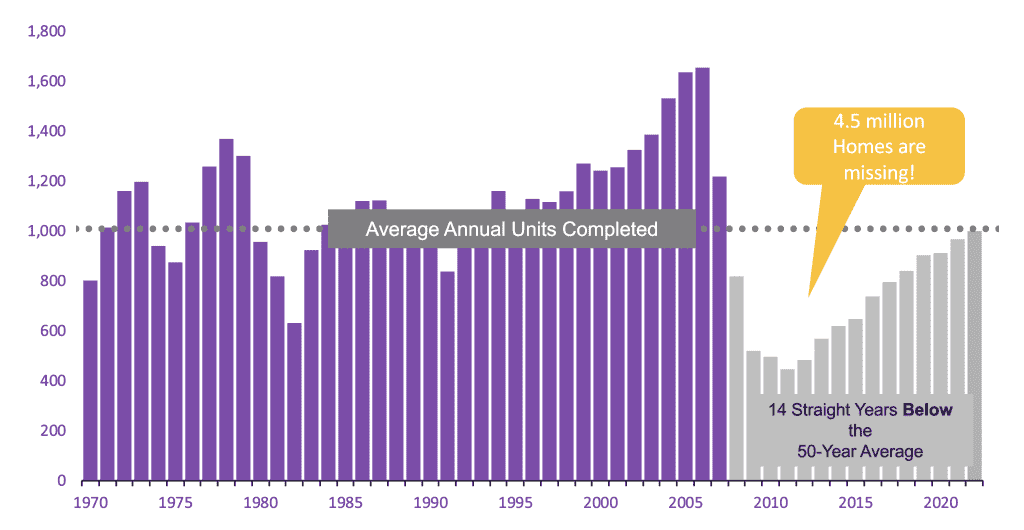
Will Prices Drop?
Supply: Why are we short of inventory? We have not been building enough homes to keep up with demand. High labor and commodity prices are not helping. In CO, scarcity of land and water, and slow governmental permitting processes are additional headwinds.
Annual number of new homes built nationally.
Historical Context: MOI
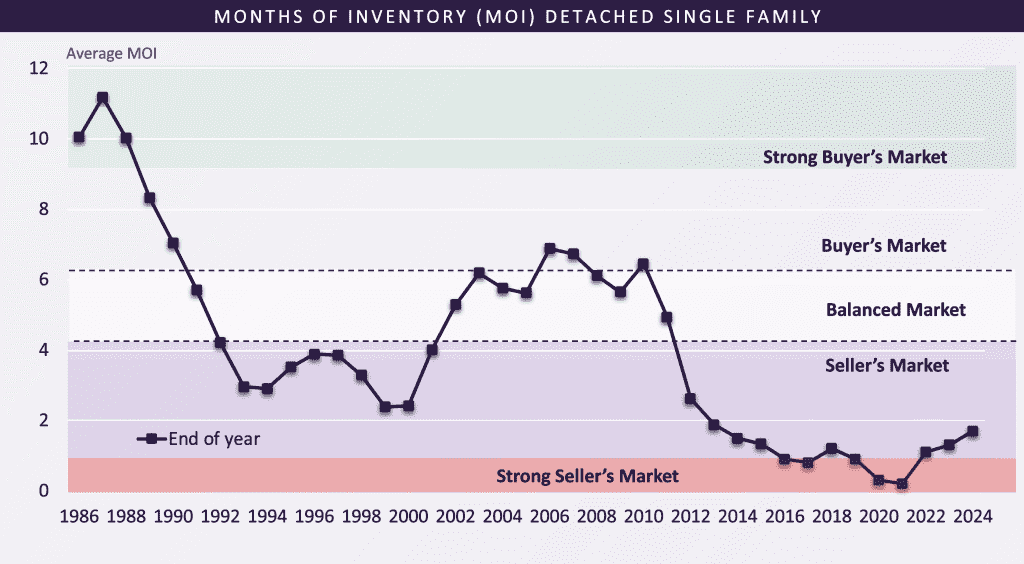
Months of Inventory (MOI) is a great metric to track the strength of the market. It is the measure of how long it would take for all the properties on the market to be sold if no more inventory came on the market.
- For e.g., if one home is selling per month in a certain neighborhood and there are currently 6 homes on the market, there would be 6 MOI in that neighborhood. (Note that Six MOI = 90 days on market.)
- MOI was high in the mid to late 80’s, reflecting our slow Denver market at that time.
- As the market strengthened going into the 90’s the MOI plummeted. During the 90’s MOI was under 4, a strong seller’s market.
- MOI began increasing in 2001 and leveled off around 2004 at 6-7 (buyer’s market).
- As the market began to strengthen after our downturn in 2007 – 2009 the MOI went down quickly. This indicates there are more buyers than sellers, and housing inventory is not keeping up with housing demand. This is where we are currently in the market.
- We have way more demand for homes than we have supply, so prices are going up.
What does it mean for the client?
- It is critical for your clients to understand the market in order to make correct decisions.
- Low MOI means a strong sellers’ market with all that implies:
- Multiple offers
- Picky sellers
- Buyers need to have their act together with strong contracts and pre-qual letters, etc.
- Sellers: use this to help show your sellers how strong the market is to list.
- Educate them on the difference between a buyer that is pre-approved vs. pre-qualified, and that not all offers are equally strong.
- Buyers: educate serious buyers on how to be a strong buyer.
We have been through tight inventory in the past (1993-2000). MOI in Q1 2022 ended at just 0.4! Inventory has now grown to 1.7 MOI in Q4 2024 – still tight but some welcome relief for buyers!
Current Market
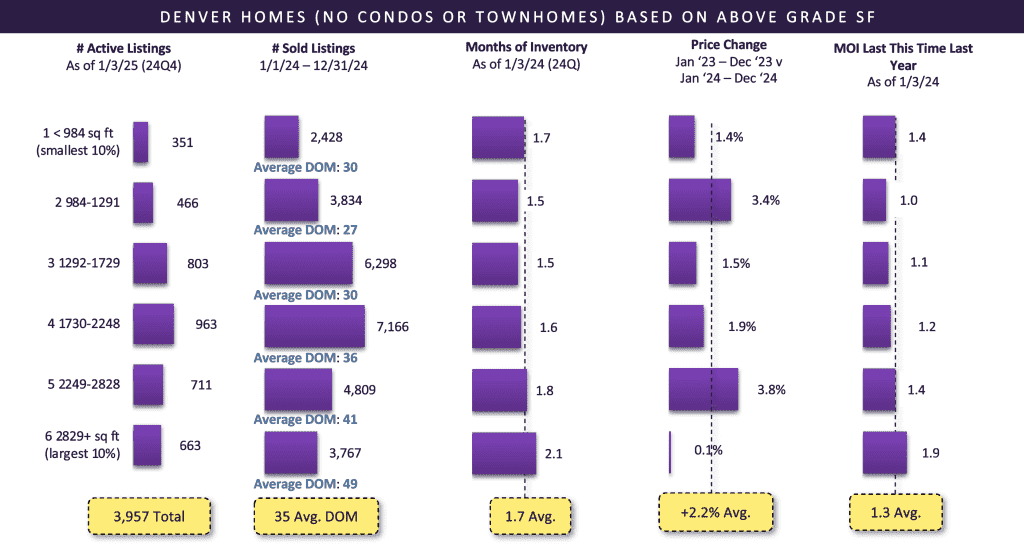
Performance of different sized homes.
Let’s look more closely at different price segments of home sales.
- This chart breaks sales down into the sizes of homes: under 1,019 sq. ft. (smallest 10%), 2,960+ SF (biggest 10%) and four buckets in between.
- It looks at the metrics for each size bucket so you can accurately assist your clients much more in making buying and selling decisions.
- Instead of just looking at neighborhood or type of home or price range we can get right down to the size of the home.
- For e.g., if your client is looking to buy a 1,700 sq. ft. home, you’d look at segment 3. 1,366-1,845 sq. ft.
What does it mean for the client?
- It’s critical for a smart buyer or seller to understand everything they can about their market, down to the size range of the property in question.
- This slide helps you provide specific, quantifiable data to your clients based on the size of their home so they can make the right decisions.
- Used in conjunction with other data like neighborhood metrics and local comps, this chart will help your clients make better decisions.
Current Market: Homes
Inventory has rebounded from historic lows and is starting to grow significantly. Prices increased slightly across the board. Inventory is up significantly vs this time last year across all segments.
Current market: Condos
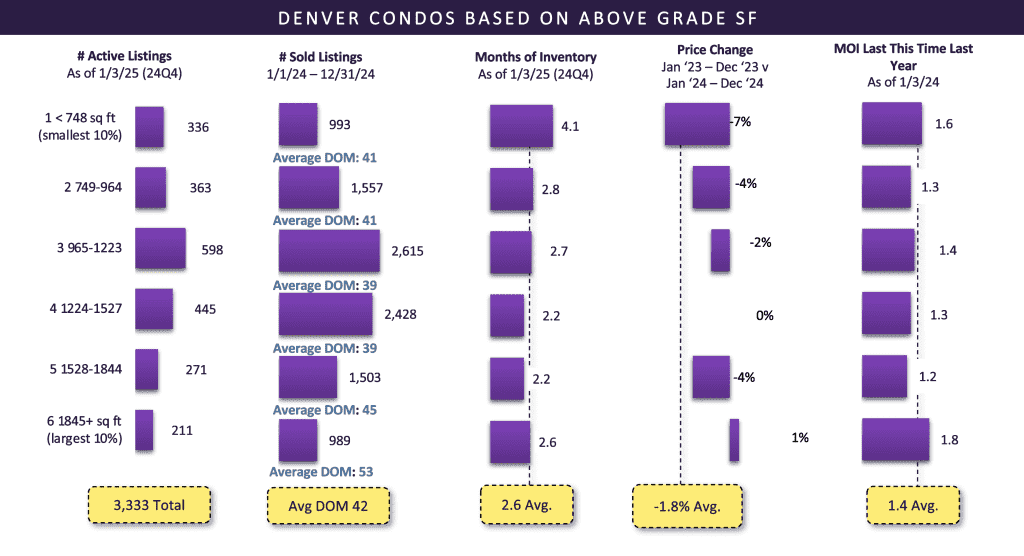
Condo inventory is increasing significantly, providing buyer relief. MOI is almost double the level observed last year. Turnover is still fairly quick. Prices pulled back a bit across the board this year vs last year.
Inventory + Population
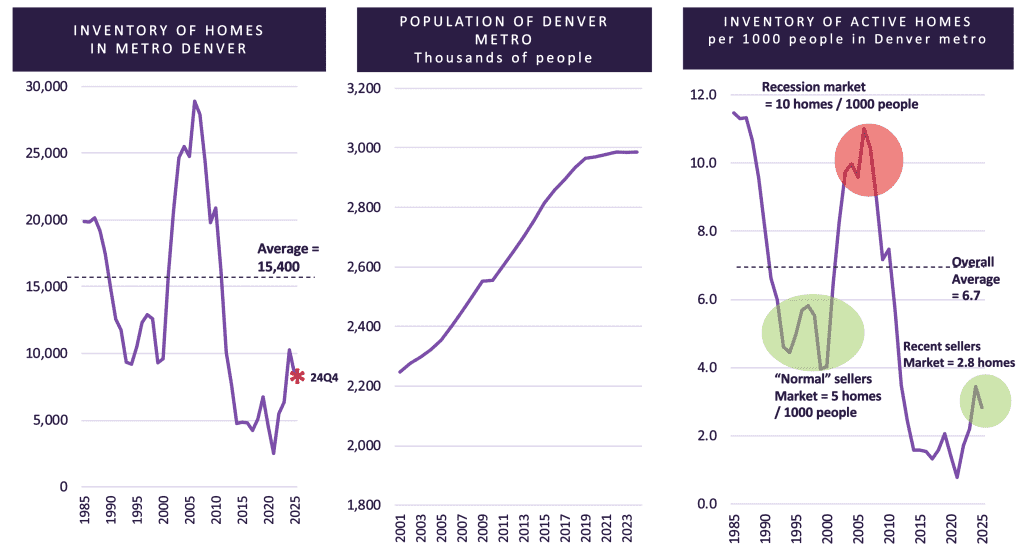
The number of homes active on the market, relative to the population, is a bit off the lowest levels ever! The inventory is just a fraction of the historical long-term average; however, it has begun to grow significantly in 2Q, continuing into Q3 2024. Inventory experienced its usual seasonal pullback in Q4 for the holidays.
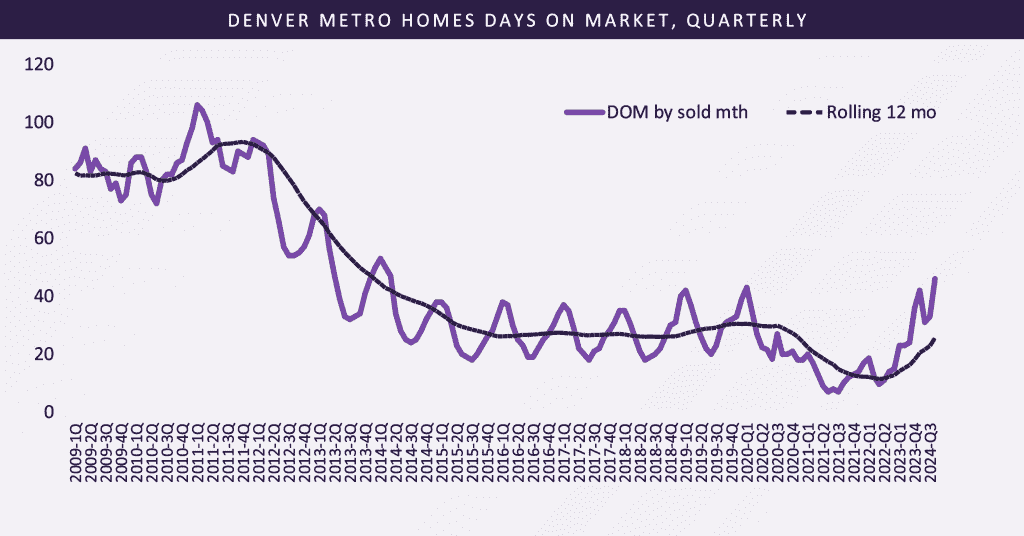
Days on Market: Homes
Single Family Home marketing times were very low during the post-COVID boom. We see now that inventories are increasing that DOM has grown. There was a pullback in 2Q 2024, with a slight rebound in 3Q. Marketing times increased in 4Q 2024.
Discount trends
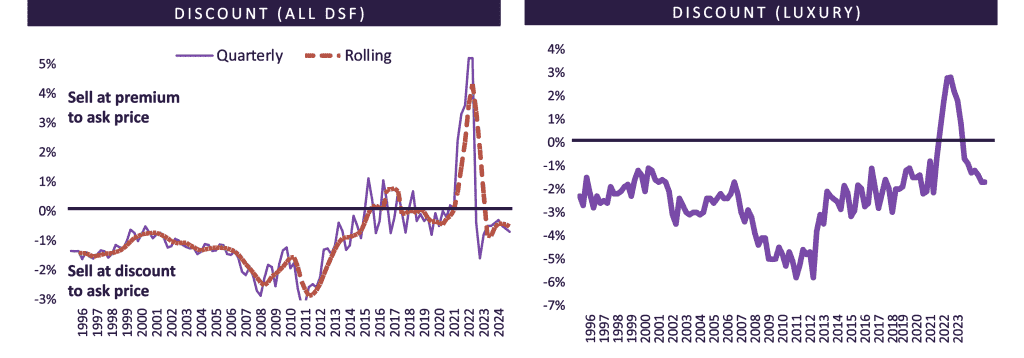
Do discounts change over a market cycle? Should one ever “low-ball”?
Answer: Not in this market! In a very strong market (2015 – early 2018, 2021), properties tend to sell for close to asking price or even at a slight premium. As inventory increases, discounts will slowly increase. To the surprise of most sellers, buyers usually will not make an offer on an overpriced house. They just move on to the next house. Ideally, a house needs to be priced within 1-3% of final sales price to get any offer. Premiums from the hot seller’s market returned to slight discounts as expected. Discounts for luxury homes have since pulled back below the average Denver home.
HOMES ONLY (NO CONDOS OR TOWNHOMES)
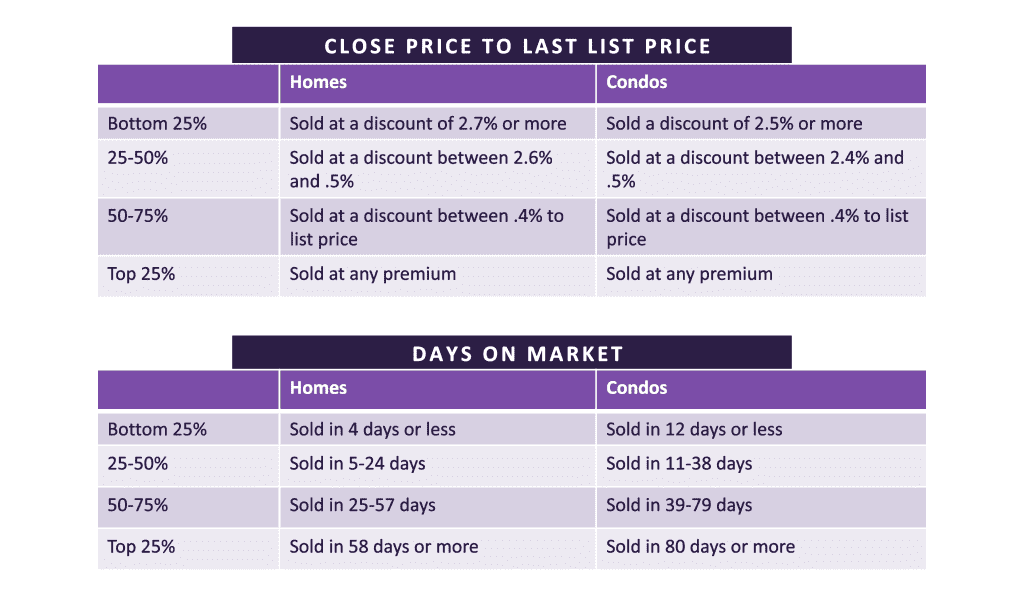
Property Performance by Quartile
Homes are now selling at discounts; premiums are very rare now that the seller’s market cooled. Regarding discounts, homes and condos are fairly similar. Turnover has been faster for homes vs condos. *Data represents sales in 4Q 2024.
Appreciation
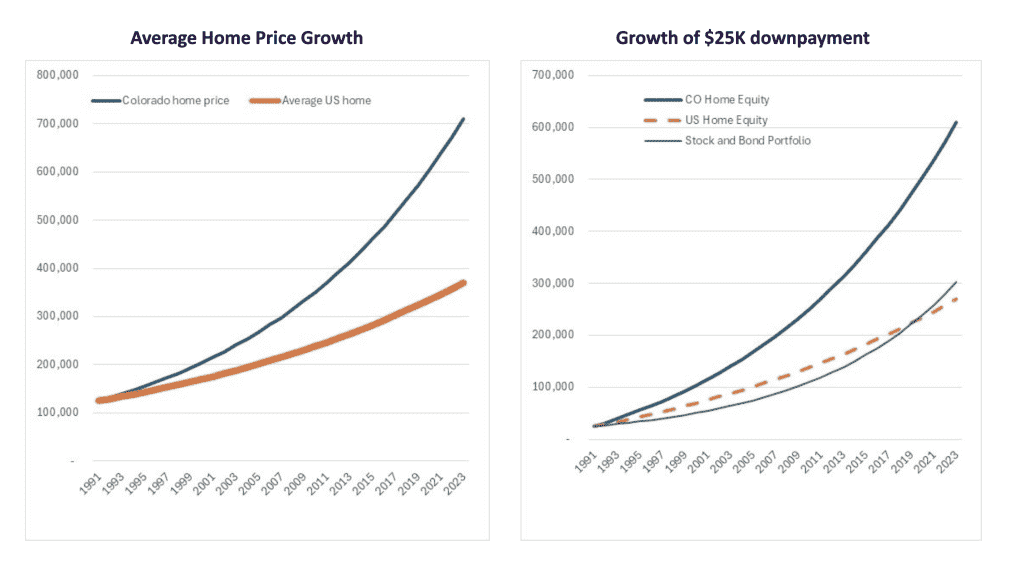
Colorado has historically been a great place for real estate appreciation.
Current home prices vs. 25 years ago.
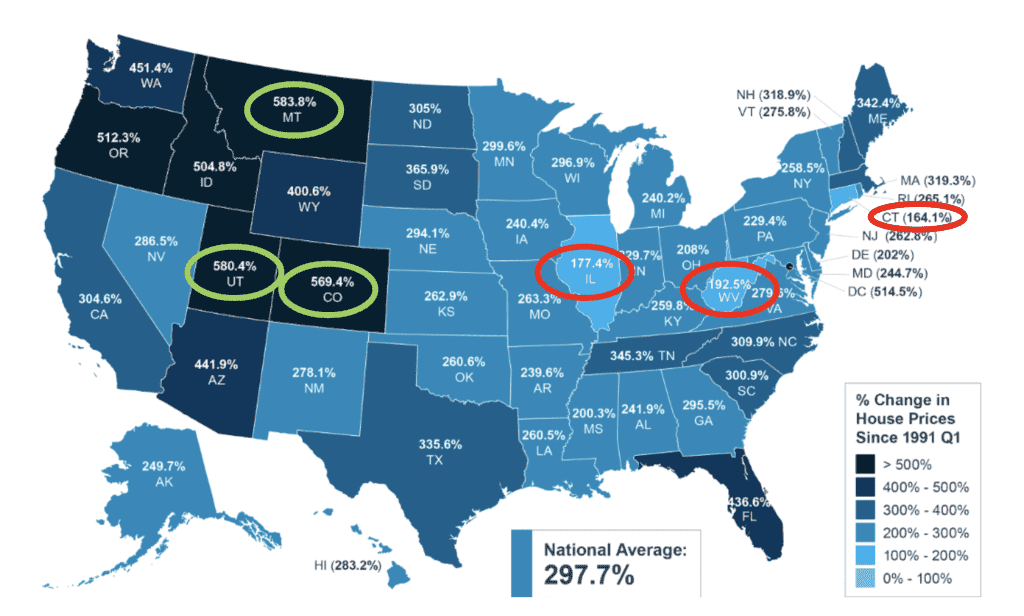
An investment in Colorado real estate outperformed a typical stock and bond portfolio in 1991-2023. The US average home appreciation was just as good!
Data Source: Ironton Investments analysis
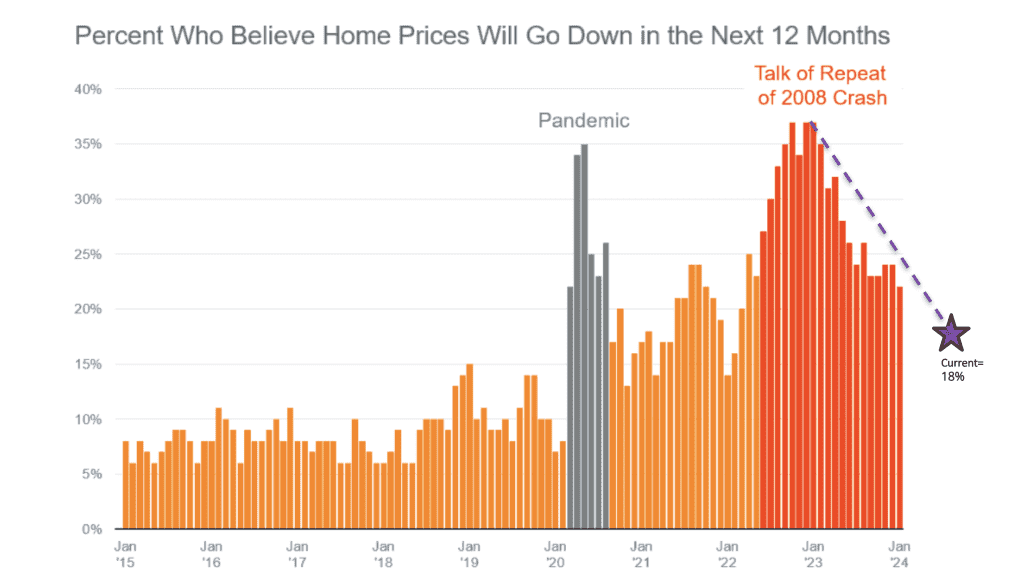
Higher consumer confidence = fewer think home prices will drop.
Should I Buy Now?
Denver wealth creation for first-time buyers. The Federal Reserve chart about net worth is interesting, but let’s try to make it a bit more tangible for Denver.
- We’ll consider several typical scenarios – this one is for a first-time buyer
- The top left looks at what that first-time buyer client might face if they buy today.
- The bottom left examines how much more their payment might be in a year if…
- Home prices go up 5%
- Interest rates go up 0.5%
- The payment could go up 11% if you wait for a year (and what will your rent do in the interim?)
- The right side is a chart depicting…
- Top: The home value, with 5% annual appreciation.
- Middle light purple: the mortgage balance, which is paid off over time.
- Lower heavy grey line: the accumulated equity (“wealth creation”) for the client.
What does it mean for the client?
- The first-time buyer’s 5% down payment of $25,000 turns into almost $400,000, or +1581%.
- For most buyers, this gain would be tax free!
- You also get to save on rent expense.
- Potentially, you deduct your property taxes and mortgage interest as tax deductions, reducing your tax burden. These benefits are not included here. Talk to your CPA.
- Historically, the stock market (S+P 500) returns around 11% per year before tax or 8% per year after tax.
- If history predicts the future, that $25,000 down payment invested in the stock would worth $54,000 (after tax) in ten years, for a 115% return.
First-time Buyer
If you buy a home today vs. next year (First Time Buyer). More than $400,000 in wealth creation in ten years!
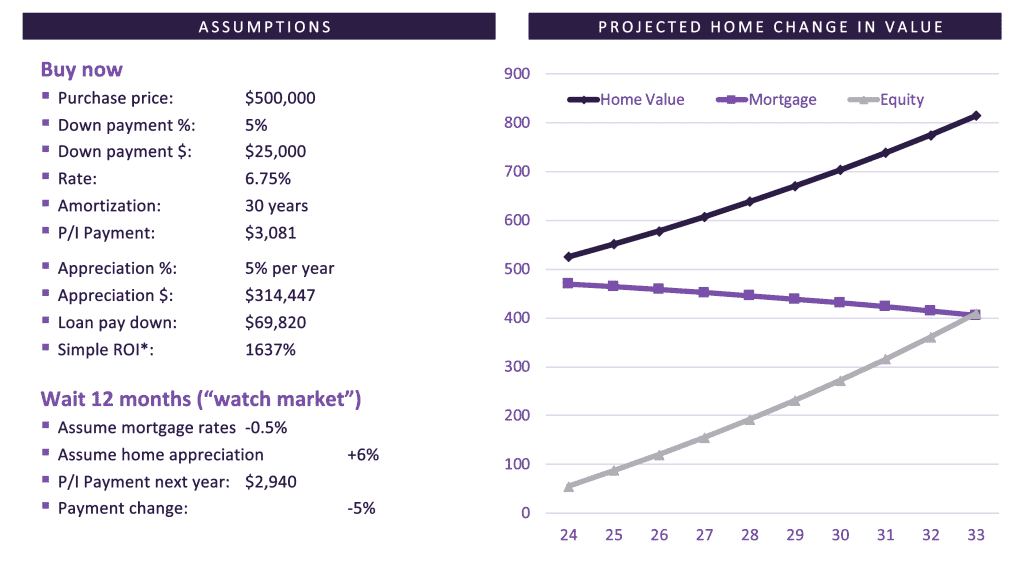
*This does not include approximately $93k paid in interest over first 10yrs.
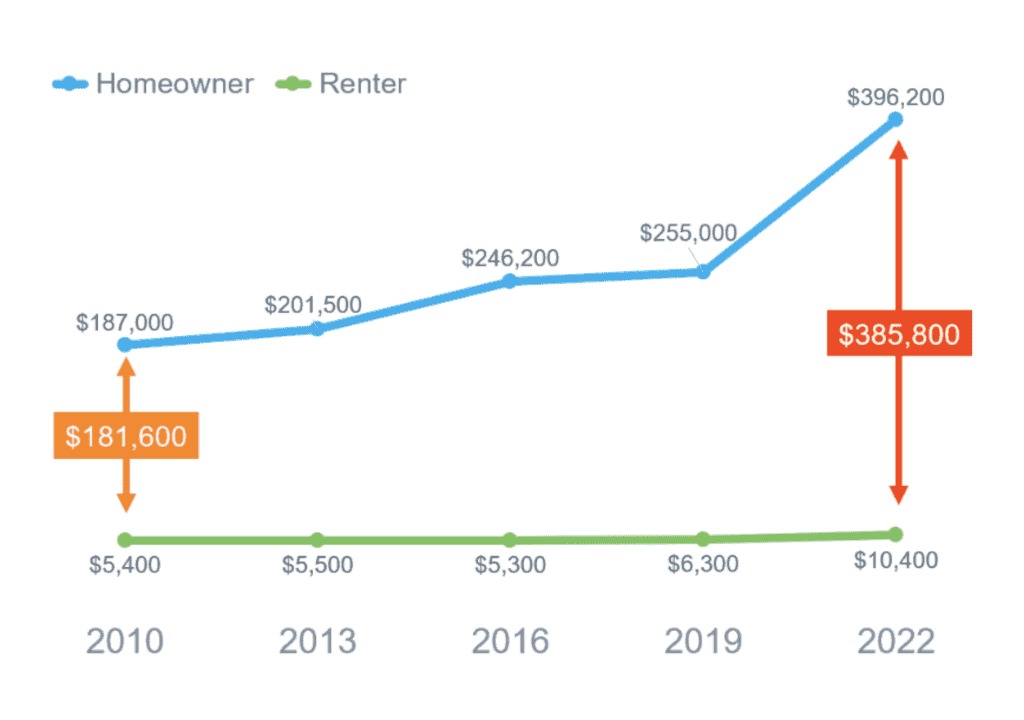
Net worth for owners is higher than renters
Research by the Federal Reserve found that homeowners accumulate 40x more net worth than renters over their lifetime.
Dangers of Overpricing
What are the dangers of overpricing?
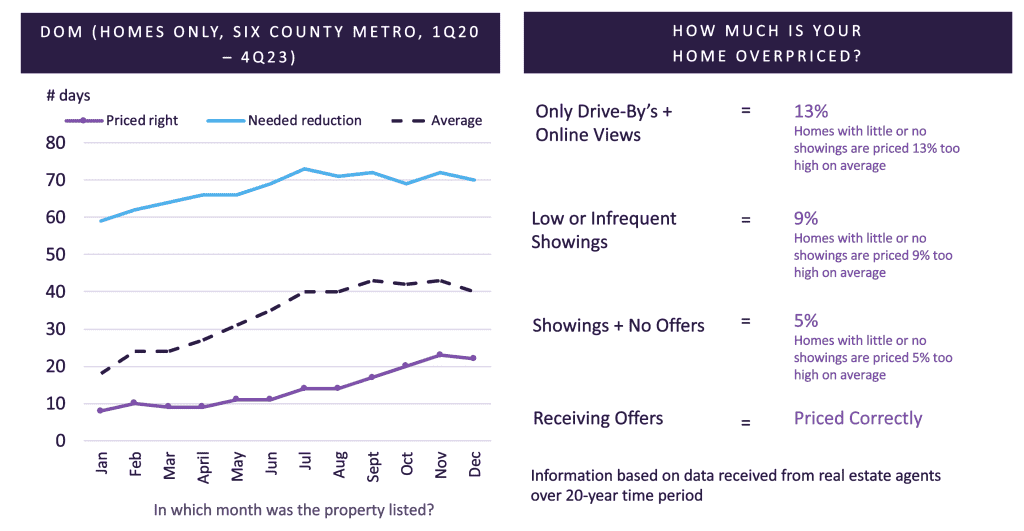
Answer: Over the past 12 months, homes that were priced right at initial listing (e.g., did not require a price reduction) sold in just twelve (12) DOM! Mispriced homes (that required a reduction) needed 68 DOM, or about FIVE times as long to get under contract.
Forecast: Population Trends
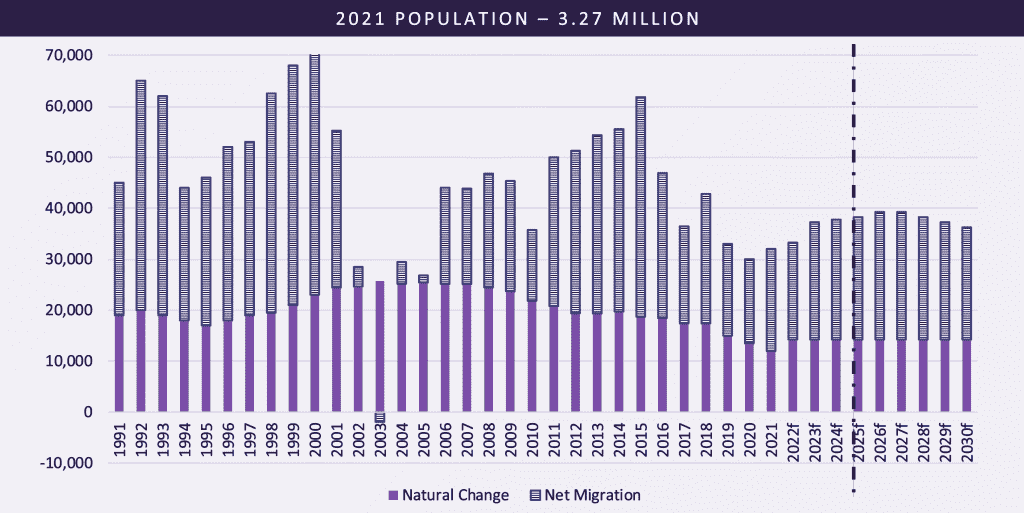
Metro Denver is one of the most desirable places to live in the country, that’s why so many people are moving here!
- Metro Denver hit 3,000,000 people in the fall of ‘14. And grew to 3,270,000 in 2021.
- We are expected to increase our population by 40,000/year for the next 10 years. That’s a LOT of growth.
- This fact alone will support the housing market and continue to make the demand for housing (both rental and purchase) stronger than the supply for years to come.
What does it mean for the client?
- More and more people are moving to the Front Range and they all need to live somewhere.
- Our increasing population should help your nervous buyers breathe easier.
- The demand for property will continue to outstrip the supply for a long time.
Economic Forecast for Denver
Local economist Patty Silverstein and the Census Bureau expect the Denver population will continue to grow around 40,000 people per year. This is down from the 50,000 net person growth rate from 1991-2015. Denver is still growing faster than many cities our size. Where are these people going to live?
Historical context: Mortgage rates
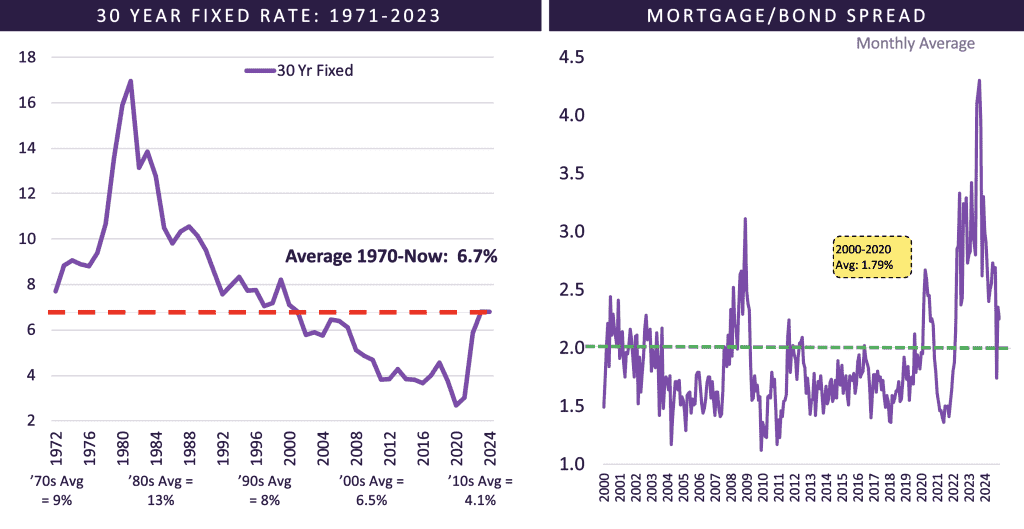
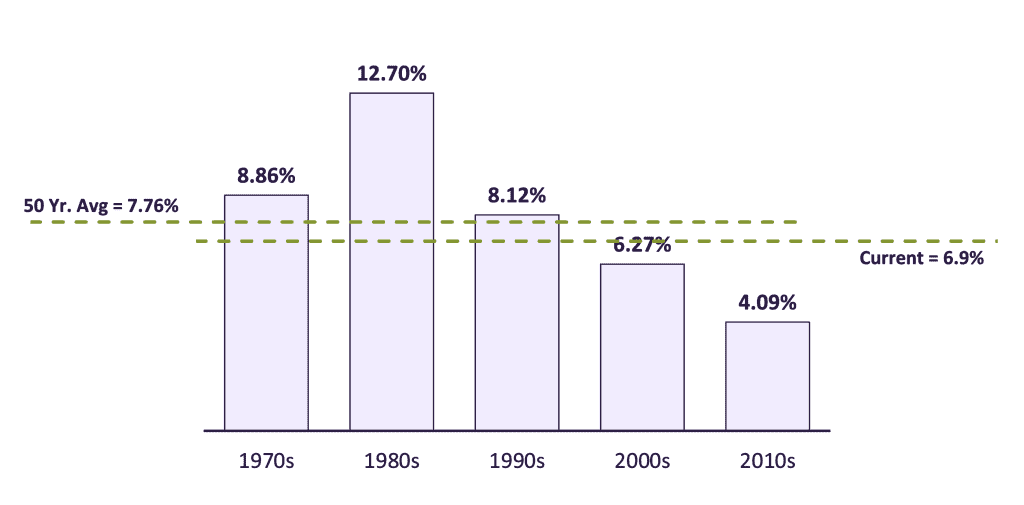
Mortgage rates continue to increase, which has made headlines. However, when looking at fifty years of history, rates are near the historical average. On the right, the mortgage spreads are much higher than historical trend… that could eventually provide some downward pressure to rates.
Another Foreclosure Boom?
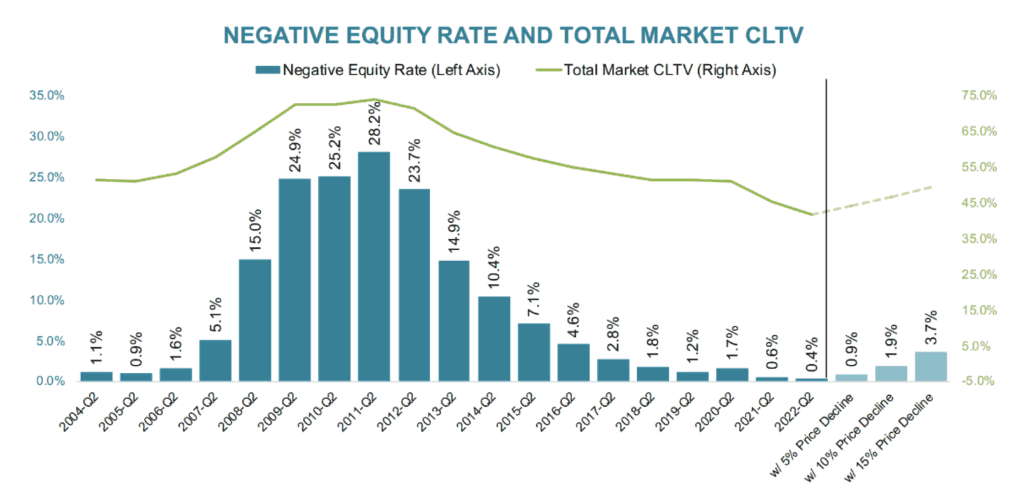
In 2010, 28% of the homes had negative equity, leading to many foreclosures. Currently, 3.7% of homes have negative equity. Owners in financial distress can easily afford to sell their homes without a short sale.
Bars: % US homes with negative equity
Line: Total market CLTV (combined loan to value)
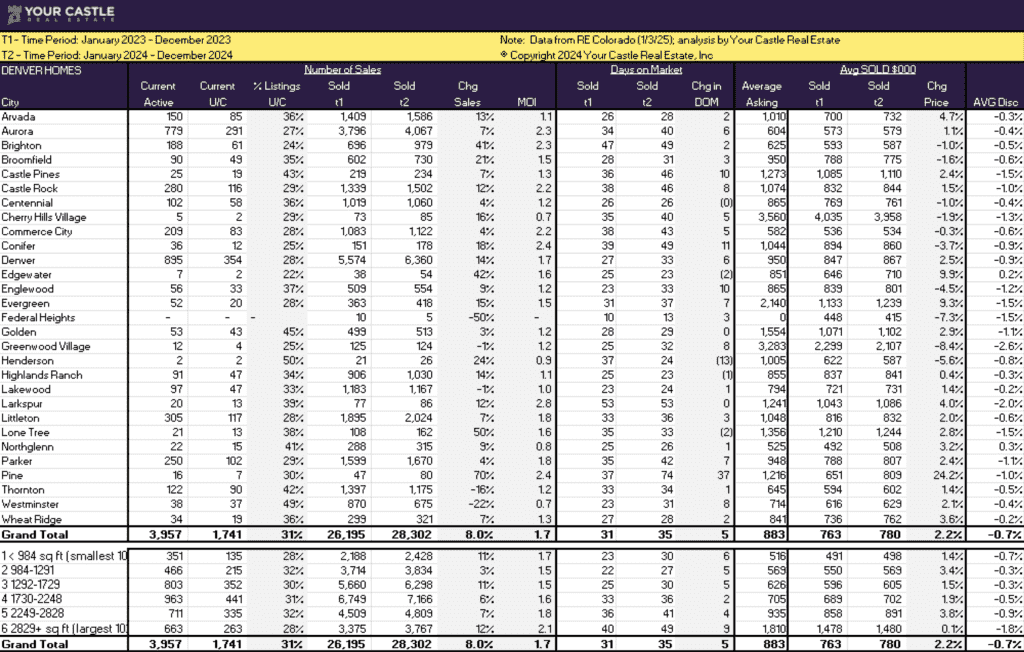
Homes Stats by Metro Denver Neighborhood
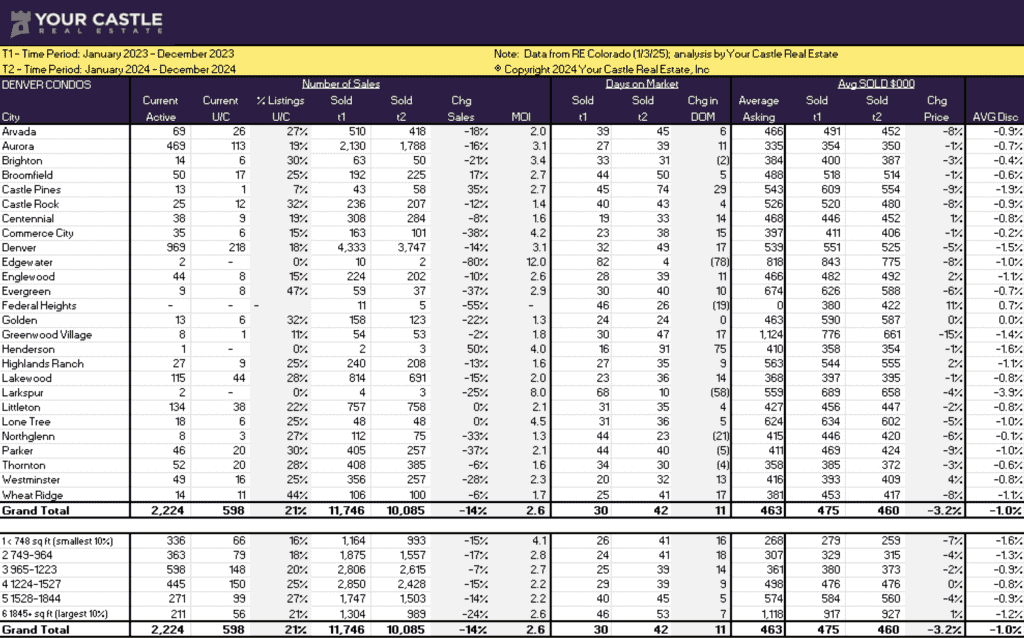
Condo Stats by Metro Denver Neighborhood
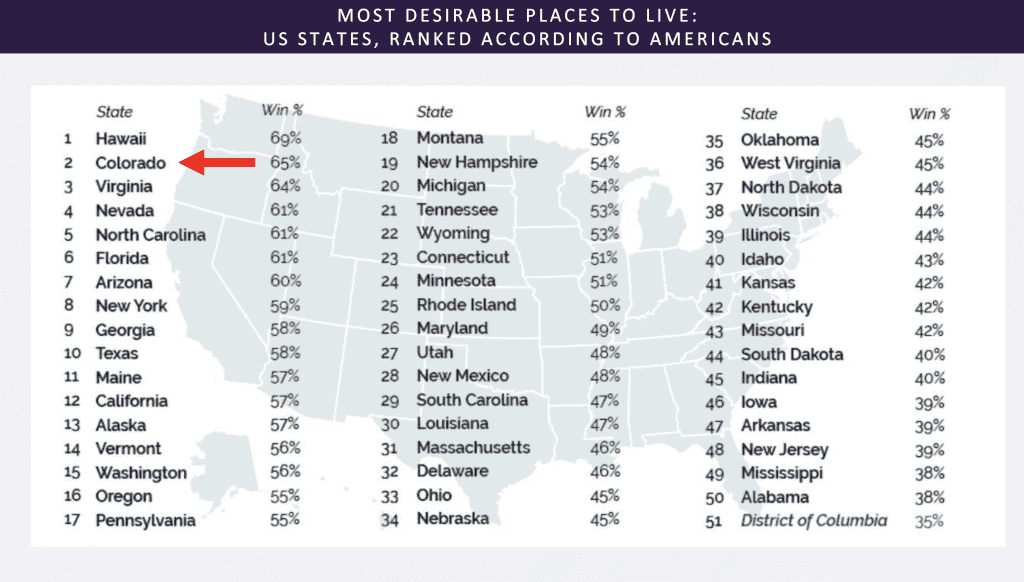
States Ranked by popularity
Colorado is number 2 most desired place to live, only behind Hawaii!
Mortgage rates increased in ‘22 but are still historically quite attractive.
The average 30-year mortgage rate by decade.
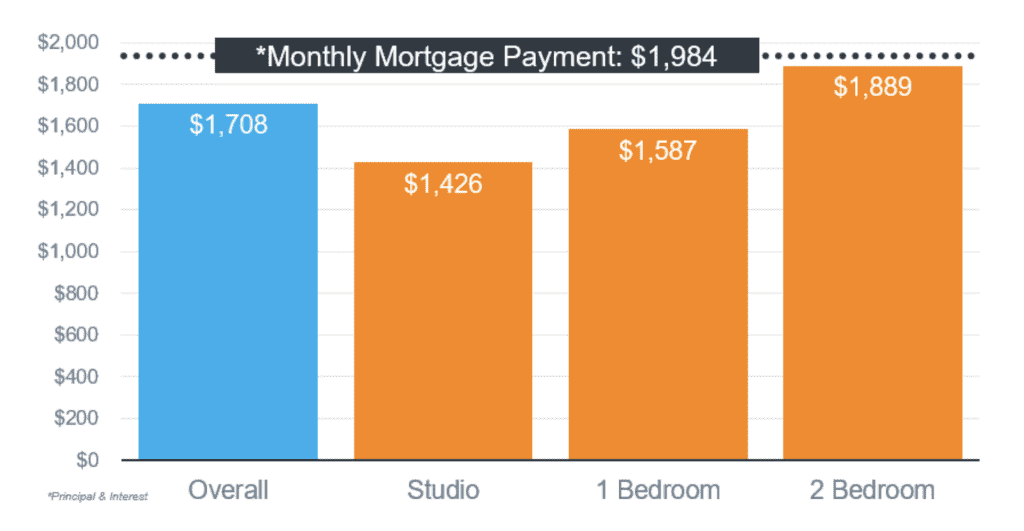
Buying a home is still a good choice relative to renting.
Median Rent in fifty largest metros vs. mortgage payment