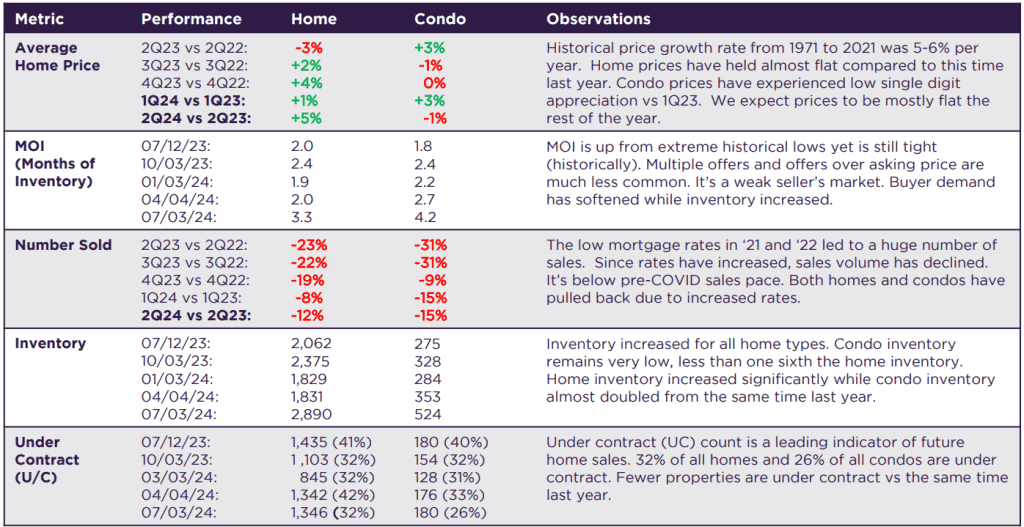
In the last twelve months, Colorado Springs homes prices have experienced low single-digit appreciation.
Inventory is up from historic lows, yet still historically tight. A little over 32% of all active homes are under
contract. Due to the sharp increase in rates, we anticipate flat pricing and fewer closed transactions.
Historical Context
Inventory levels of homes:
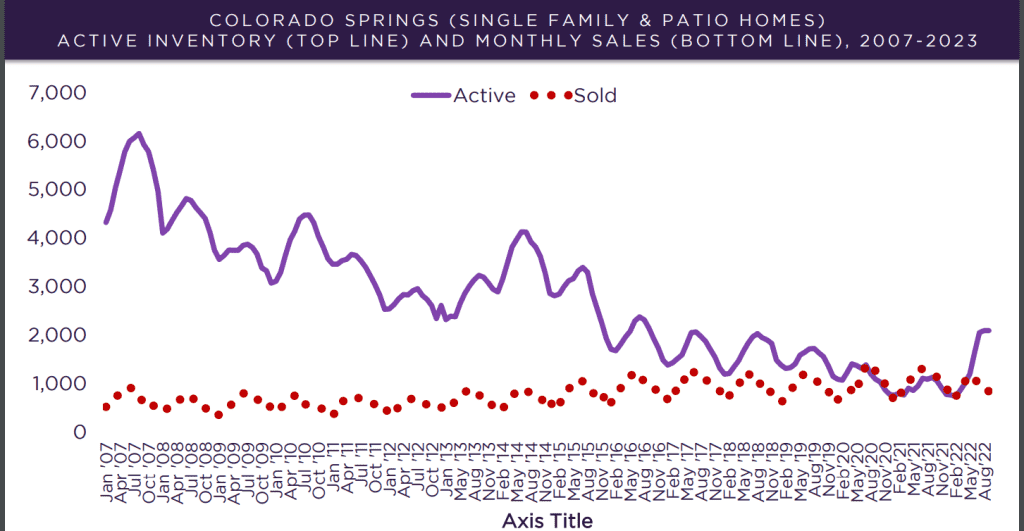
On the left side of the chart:
- The solid line on the top of the chart is the number of homes and condos for sale, from
2008 to today.- Notice the line is very high in 2008, due to LOTS of bank foreclosures.
- Buyers didn’t buy as much during the downturn
due to the scary media headlines and job loss. - As a result inventories were high.
- The dotted line on the bottom shows the number of homes sold each month.
- Notice it’s been trending upwards.
- This was caused by an improving economy and growth in the population.
- Note more homes are sold in the summer than the winter.
- Investors buy consistently all year.
- Families with kids in school prefer to move in the summer.
On the right side of the chart:
- Notice that the number of sales is about the same as the number of homes for sale.
- There’s very little inventory and it’s competitive for buyers.
Other observations:
- We didn’t arrive in this low inventory situation overnight. It took almost a decade to burn off all of the excess bank inventory.
What does it mean for the client?
As long as the inventory is tight
- Buyers will have to compete hard (write great offers) to win a home.
- Sellers will generally have the edge in negotiations.
Inventory vs. sales since 2007
Inventory began to slowly build in 2019, but in 2020 it tightened yet again. Sales dropped below 1000 in December of last year. The volume of sold properties was greater than those even available for sale for nearly all of 2021. This chart is only for single family homes; the condo chat looks very similar. Inventory continues to build while sales contract.
Historical context: MOI
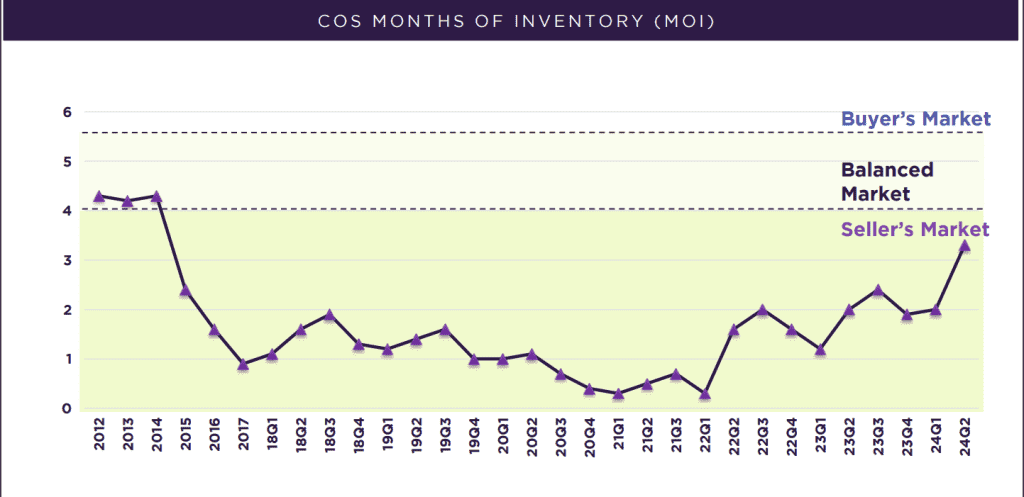
Months of Inventory (MOI) is a great metric to track the strength of the market. It is the measure
of how long it would take for all the properties on the market to be sold if no more inventory came
on the market.
For e.g., if one home is selling per month in a certain neighborhood and there are currently 6 homes on the market, there would be 6 MOI in that neighborhood. (Note that Six MOI = 90 days on market.)
MOI was high in the mid to late 80’s, reflecting our slow Denver market at that time.
- As the market strengthened going into the 90’s the MOI plummeted. During the 90’s MOI was under 4, a strong seller’s market.
- MOI began increasing in 2001 and leveled off around 2004 at 6-7 (buyer’s market).
- As the market began to strengthen after our downturn in 2007 – 2009 the MOI went down quickly. This indicates there are more buyers than sellers, and housing inventory is not keeping up with housing demand. This is where we are currently in the market.
- We have way more demand for homes than we have supply, so prices are going up.
What does it mean for the client?
- It is critical for your clients to understand the market in order to make correct decisions.
- Low MOI means a strong sellers’ market with all that implies:
- Multiple offers,
- Picky sellers,
- Buyers need to have their act together with
strong contracts and pre-qual letters, etc.
- Sellers: use this to help show your sellers how strong the market is to list.
- Educate them on the difference between a buyer that is pre-approved vs. pre-qualified, and that not all offers are equally strong.
- Buyers: educate serious buyers on how to be a strong buyer.
Months of inventory
Months of inventory has steadily tightened since 2012. It got very tight at the end of 2019
through early 2022. It became a seller’s market back in 2015. Inventory has finally started to
increase sharply from record lows. MOI on 7/03/24 was 3.3 for homes and 4.2 for condos. Some
welcome long-awaited relief for buyers!
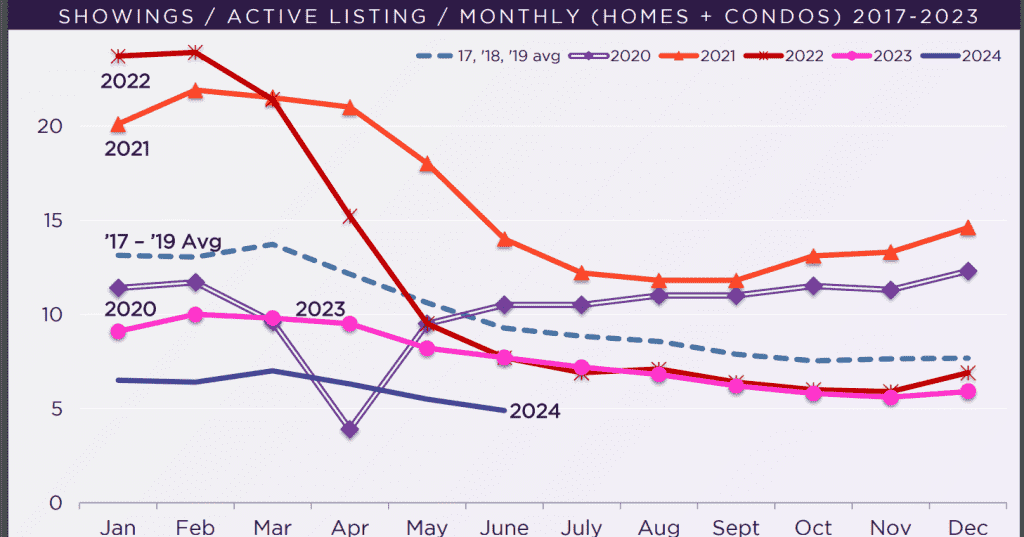
Current market: showing trends
June saw a normal downshift in numbers, bringing the year to an eight-year low. Listing agents hope to see it turn around soon!
Current market
Performance of different size homes.
Let’s look more closely at different prices segments of home sales.
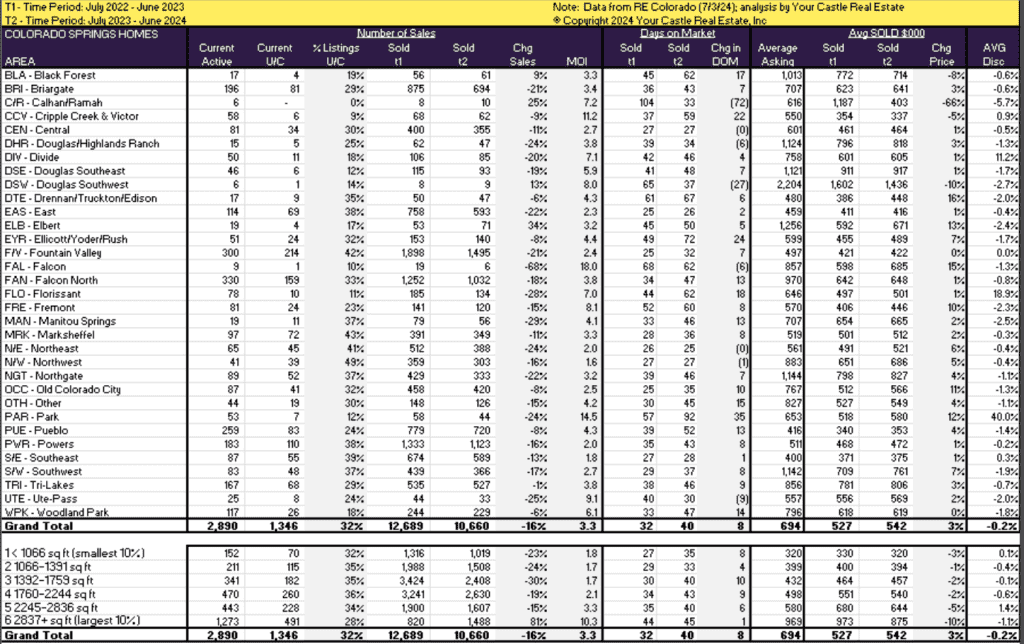
- This chart breaks sales down into the sizes of homes: under 1089 sq. ft. (smallest 10%), 3,305+ SF (biggest 10%) and four buckets in between.
- It looks at the metrics for each size bucket so you can accurately assist your clients much more in making buying and selling decisions.
- Instead of just looking at neighborhood or type of home or price range we can get right down to the size of the home.
- For e.g., if your client is looking to buy a 1,600 sq. ft. home, you’d look at segment 3 1392- 1759sq ft.
- You see there’s only 1.7 MOI, prices are fairly flat year over year.
- 34% of the properties in this size range on the MLS are ALREADY under contract.
What does it mean for the client?
- It’s critical for a smart buyer or seller to understand everything they can about their market, down to the size range of the property in question.
- This slide helps you provide specific, quantifiable data to your clients based on the size of their home so they can make the right decisions.
- Used in conjunction with other data like neighborhood metrics and local comps, this chart will help your clients make better decisions.
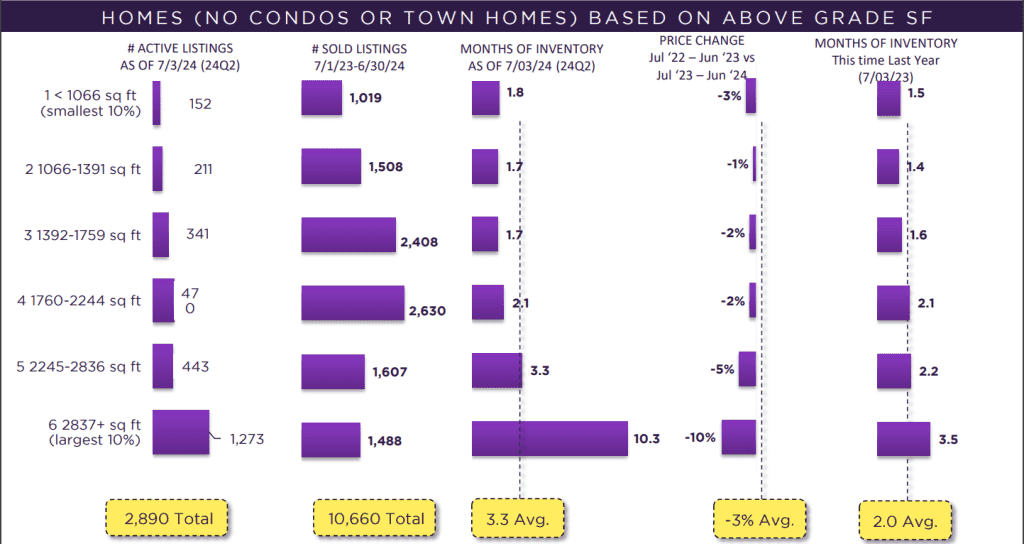
COS market by size: homes
The Colorado springs detached single family market is much larger that of its attached property market. Marketing time is still low for smaller homes and much higher in the larger segments. Inventory is low for smaller homes but building up in the larger segments. Home prices are down with a decent pullback among larger homes.
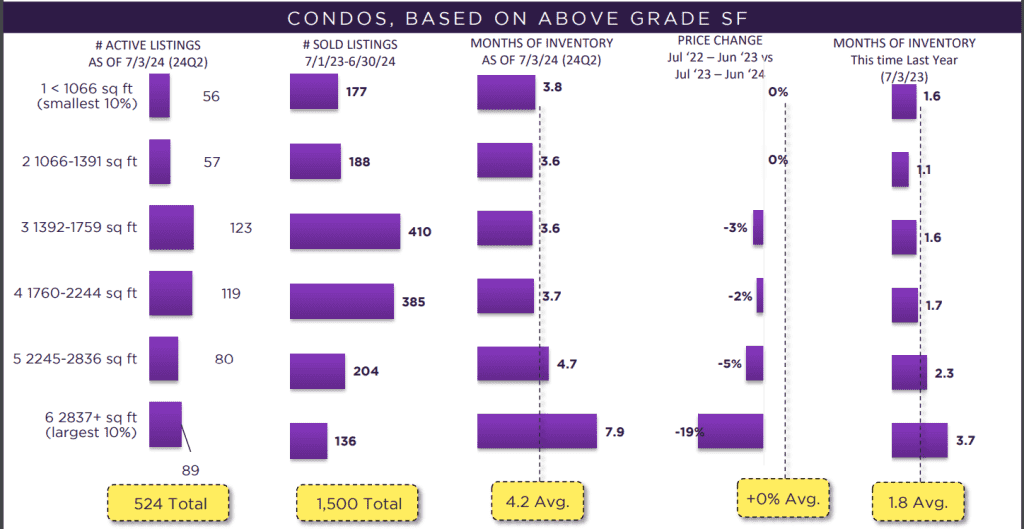
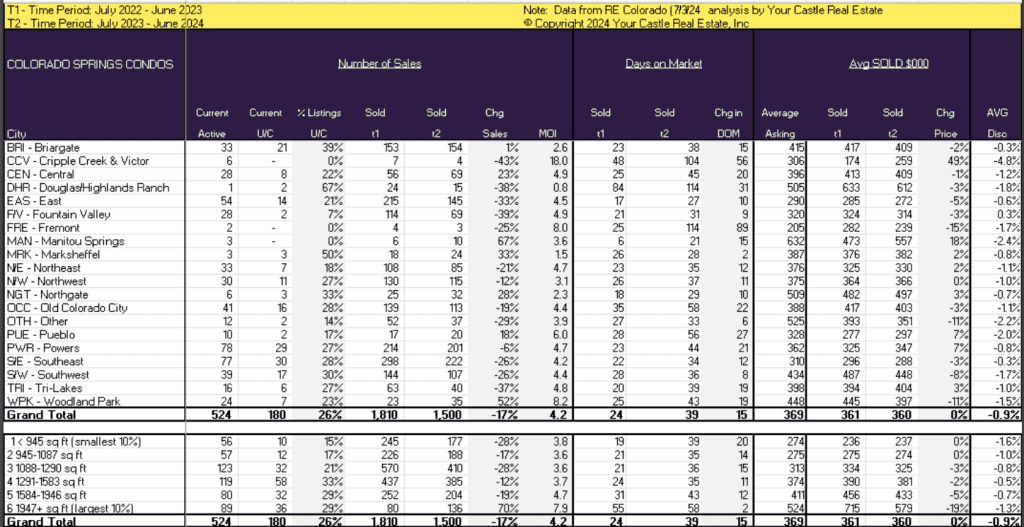
COS market by size: condos
Inventory for attached homes remains low, especially due to the small amount of this inventory type in this market. Very few of the smaller units are on market. Marketing times are longer for all segments, especially the larger ones vs this time last year. We see 7.9 MOI for larger condos. Prices among smaller homes were flat, with more significant pullbacks with the largest segment.
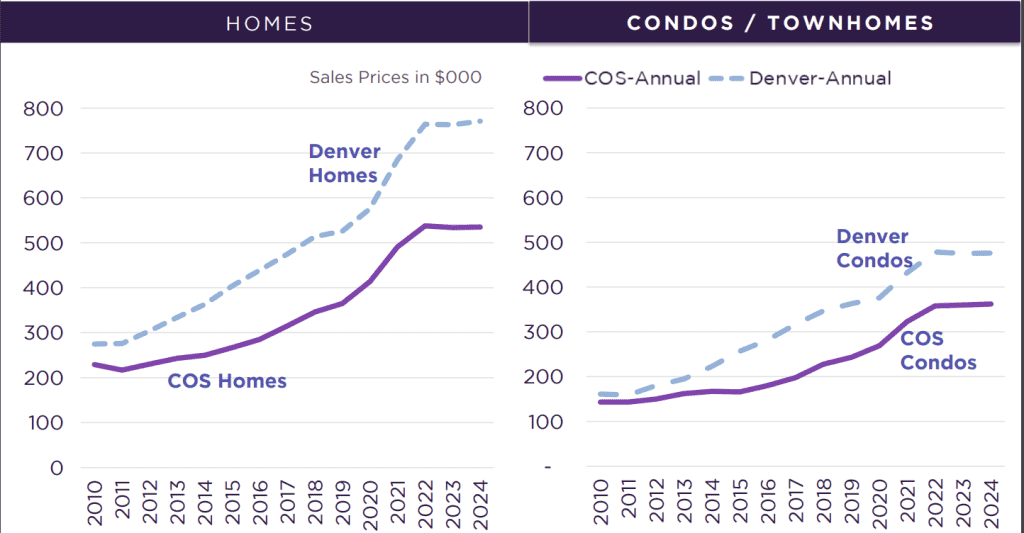
Historical context comparisons
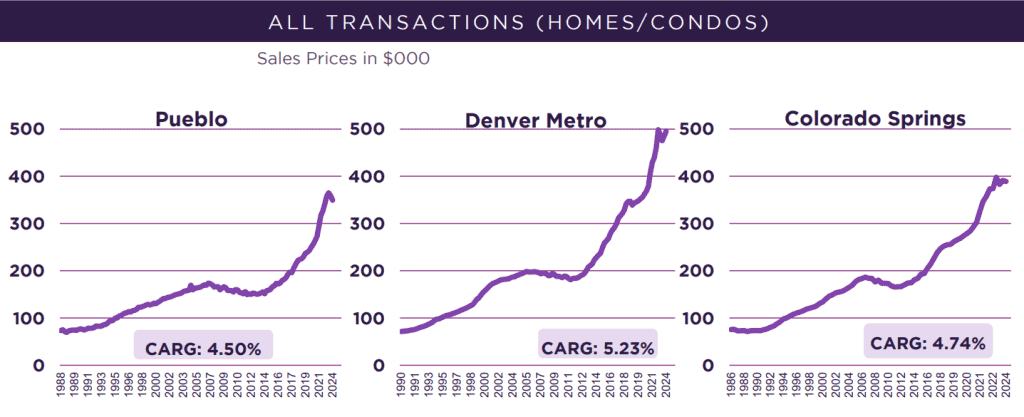
Both markets (Denver and Colorado Springs) have seen significant price appreciation in the past decade The home & condo prices in both markets have leveled off, driven by increases in interest rates and overall market cooling.
Similar patterns across all three markets: Pueblo, Denver Metro, Colorado Springs. Denver regained its losses from the Great Recession by 2013, while COS and Pueblo took two years longer. Denver continues to have the fastest rate of growth… but the lead is smaller than most people think. All three markets have experienced a slight pullback in home price after approximately 10 years of appreciation.
Data Source: https://fred.stlouisfed.org
Historical context: mortgage rates
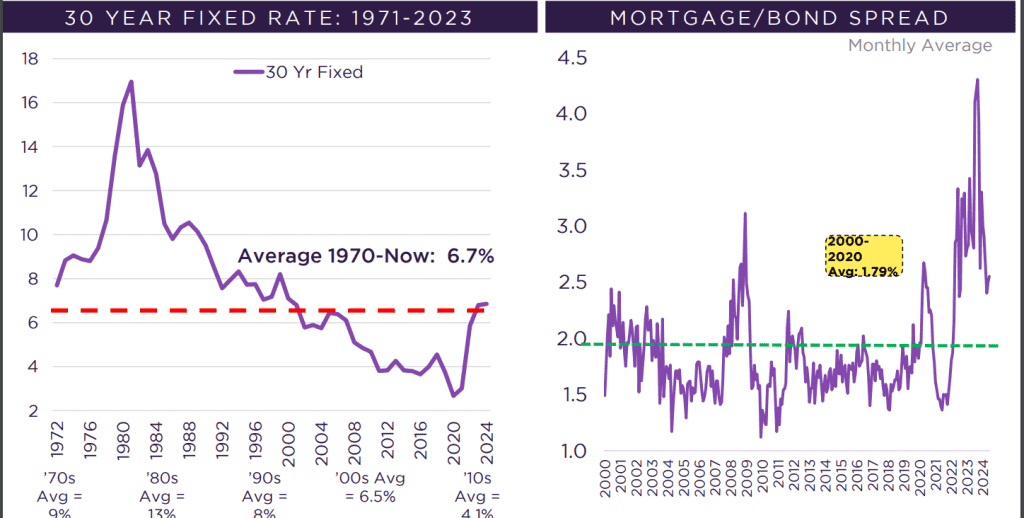
Mortgage rates continue to increase, which has made headlines. However, when looking at fifty years of history, rates are near the historical average. On the right, the mortgage spreads are much higher than historical trend… that could eventually provide some downward pressure to rates.
Net worth for owners is higher than renters
Homeowners are the 1%’ers!
- Well, it’s not quite that simple .. but what is true is that the vast majority of wealth in America is held by homeowners, not renters.
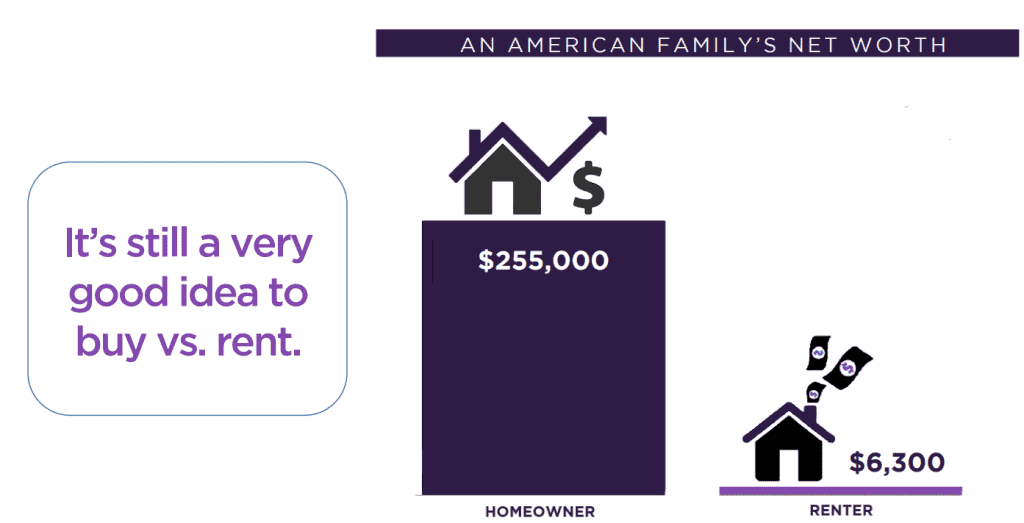
- The average net worth of a U.S. homeowner in 2019 was $255,000, compared to just $6,300 for the average renter.
- The numbers are shocking, and renters definitely aren’t aware of this, so educate them. Let them know that if they want to build wealth over time owning a home is the tried and true formula.
- Investors (landlords) with a few rental properties do even better!
- The more the world changes, the more it stays the same – buying a home is the right thing to do to house one’s family and build long term wealth.
- Or they can just make their landlord happy (and wealthy) forever. Whichever they choose.
What does it mean for the client?
- If you are renting you should STRONGLY consider buying if you want to build wealth. The
numbers are clear.
1st time buyer
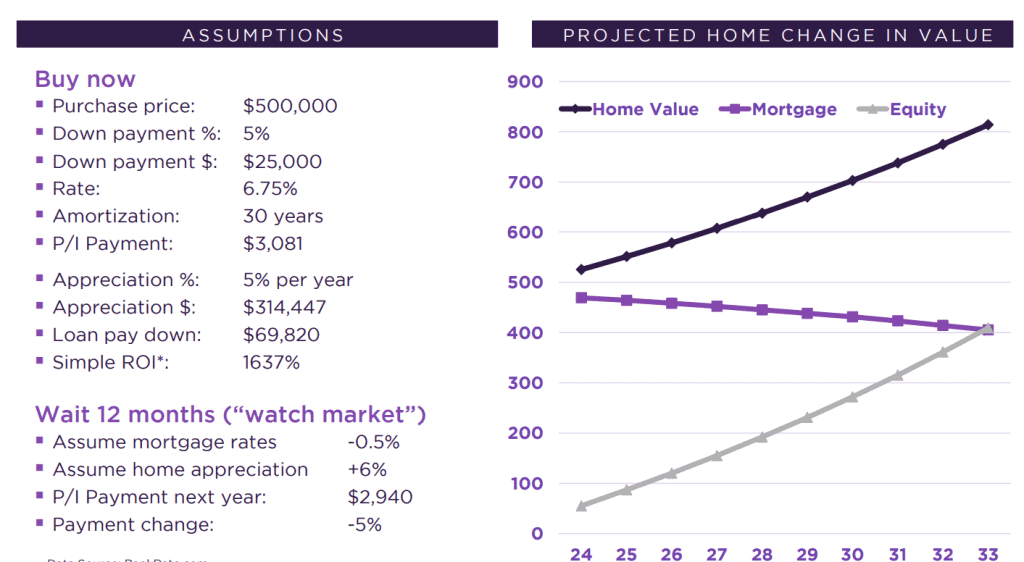
If you buy a home today vs. next year (First Time Buyer). More than $400,000 in wealth creation in ten years!
*This does not include approximately $93k paid in interest over first 10yrs
Net worth for owners is higher than renters
Buying is generally more affordable and less expensive than renting. In addition, research by the Federal Reserve found that homeowners accumulate 40x more net worth than renters over their lifetime.
Wealth creation for an investor
How can investors generate wealth with rentals?
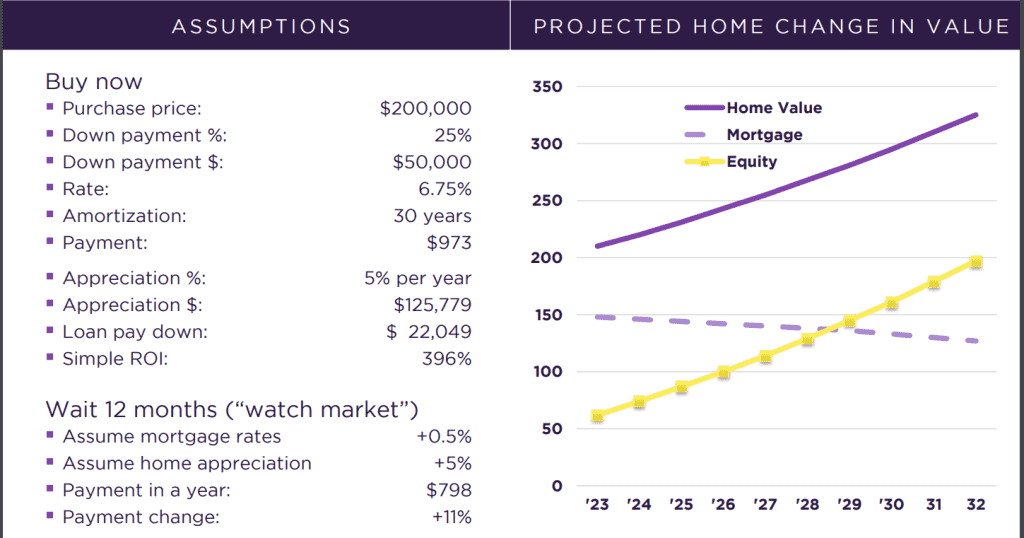
- The top left looks at what that client might face if they buy today.
- The bottom left examines how much more their payment might be in a year if…
- Home prices go up 5%.
- Interest rates go up 0.5%.
- Your payment could go up 9% if you wait for a year.
- The right side is a chart depicting…
- Top: The home value, with 5% annual appreciation.
- Middle blue: the mortgage balance, which is paid off over time.
- Lower green line: the accumulate equity (“wealth creation”) for the client.
What does it mean for the client?
- The buyer’s 25% down payment of $50,000 turns into $198,000, or +298% (pre-tax) in 10 years.
- For many buyers, this gain would be subject to capital gains tax. You should have positive cash flow each year and enjoy an annual depreciation write-off. These benefits are not included here. See your CPA.
- Historically, the stock market (S+P 500) returns around 11% per year before tax or 8% per year after tax.
- If history predicts the future, $25,000 down payment invested in the stock would be worth $67,240 (after tax) in 10 years, for a 269% return.
What changed from prior example?
- Purchase price $100K (rental condo)
- 15-year loan term.
- 25% down vs. 20% down.
- Rate goes up a little (investor loan rates are often higher than owner occupant rates).
Investor buyer
There’s an expected 396 % ROI over 10 years if you buy a rental property today (and this doesn’t even include cashflow!). Even though home prices are up about 40% in four years, rents have gone up about the same amount. An investor can still earn great returns today!
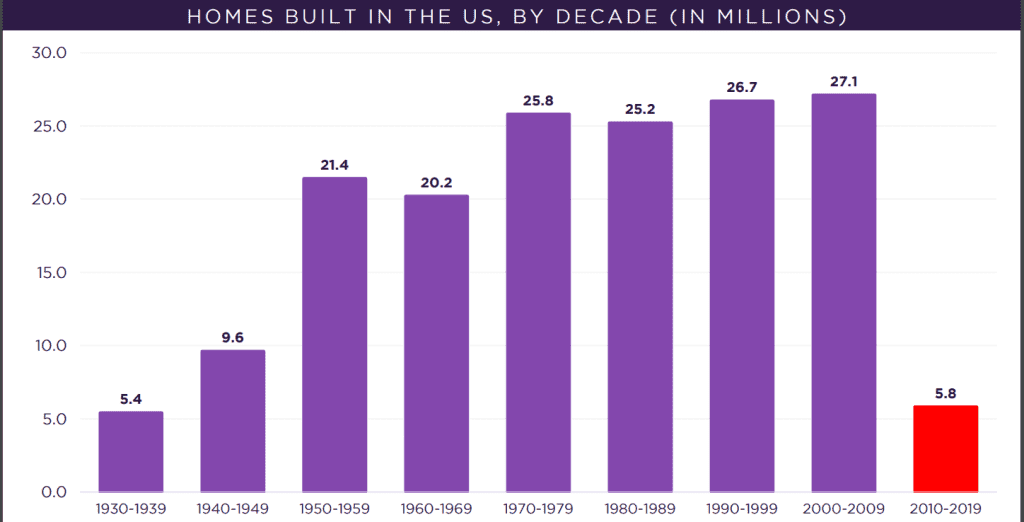
Home builds in the United States
Why is the inventory so low? Denver has experienced strong population growth in the past decade, but almost no additional inventory from new home builders. Builders are limited by high costs for land, water taps, labor, and materials. We don’t anticipate a boom in construction. As a result, inventories could remain low for several years.
Current market conditions by area: condos
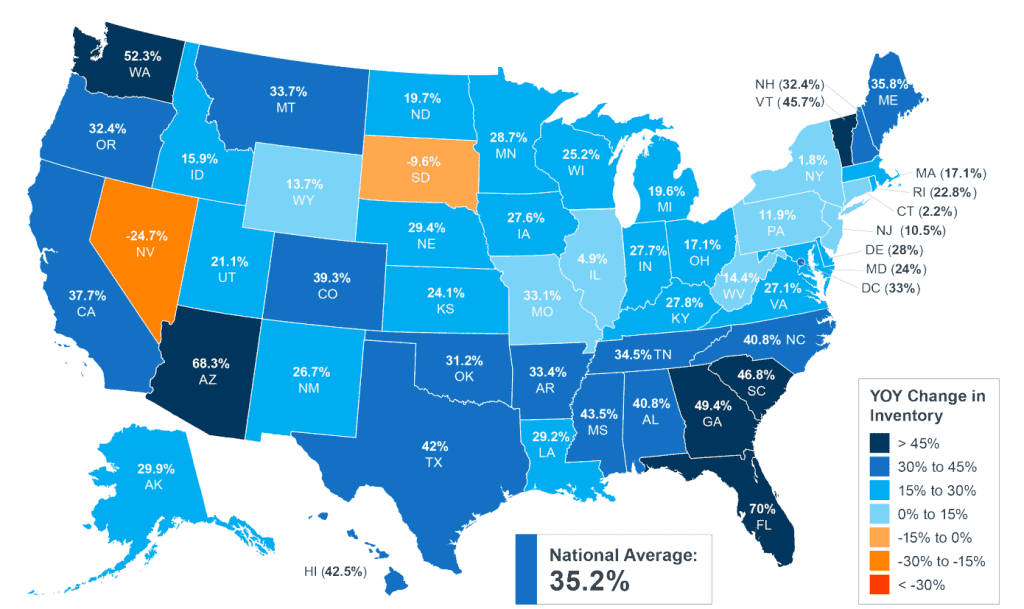
Inventory
There is a lot more inventory now than this time last year. While better than ‘23, current
inventory is still off from pre-COVID.
Inventory May ‘24 vs May ‘23
Appreciation
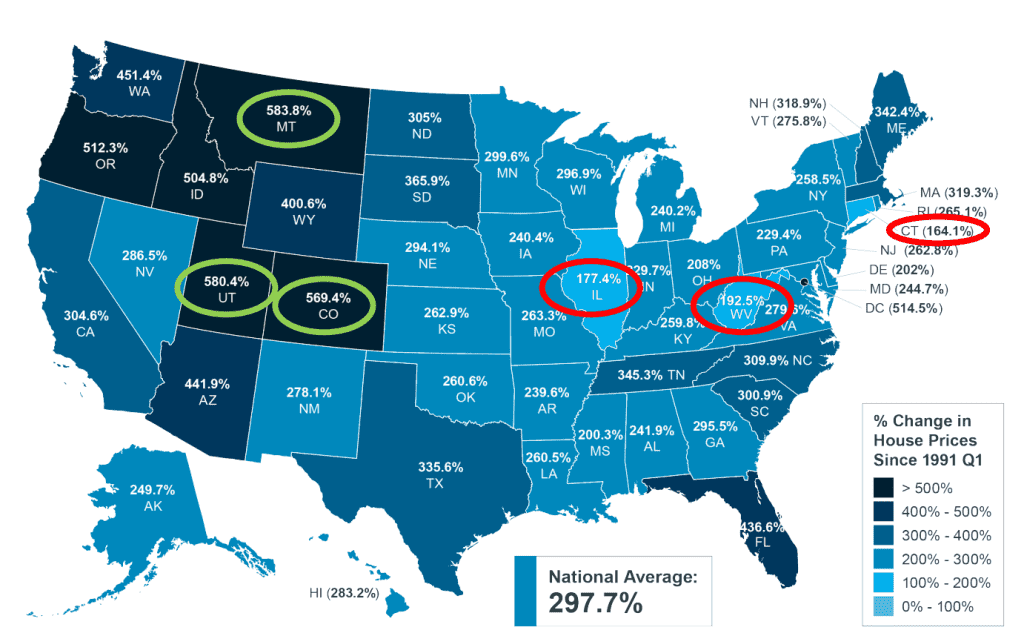
Colorado has historically been a great place for real estate appreciation.
Current home prices vs. 25 years ago.